
Building AI Agents: The Architecture Guide We Wish We Had
Building AI Agents: The Architecture Guide We Wish We Had Building AI agents turned out to be one of those adventures that started with wide-eyed

You need to provide your historic demand data to Amazon Forecast and it handles the rest. It will create a data pipeline to ingest data and then train a model, provide accuracy metrics and create forecasts. But in the background, it’s doing a lot more. It’s identifying features from your data set and applying the best algorithm that suits your data type and tunes those forecasting models. Then it holds that model so that when you forecast, you can easily query the service, for further computation.
Amazon Forecast can be used for a number of functions apart from inventory planning, including work force and web traffic predictions, this requires defining of the forecasting domain to compute the appropriate model.
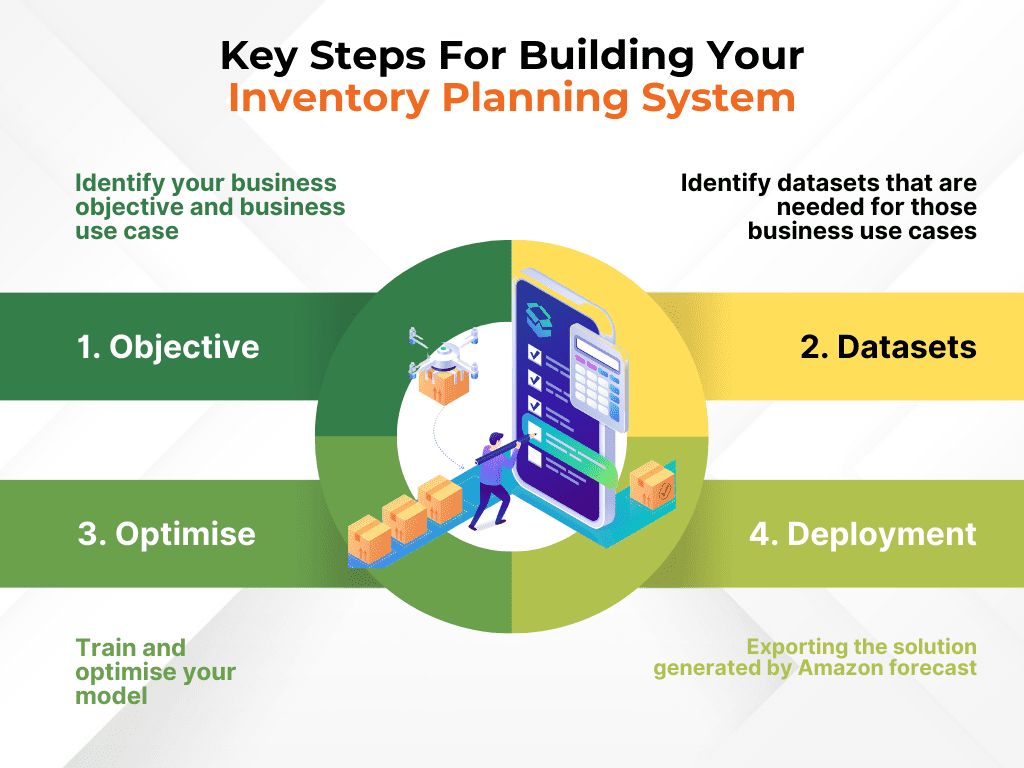
First I will walk you through the process of generating forecast from aws console and then walk you through the steps to generate this programmatically.
Create suggested orders using AWS Forecast for the customers based on their average depletion rate of the products and quantities on hand.
Our input data was the historical sales data(customer, product id, quantity and date) and the output was predicted sales data for the next few weeks (customer, product, quantity and predicted date)
1.Create a dataset group.
Creation of dataset
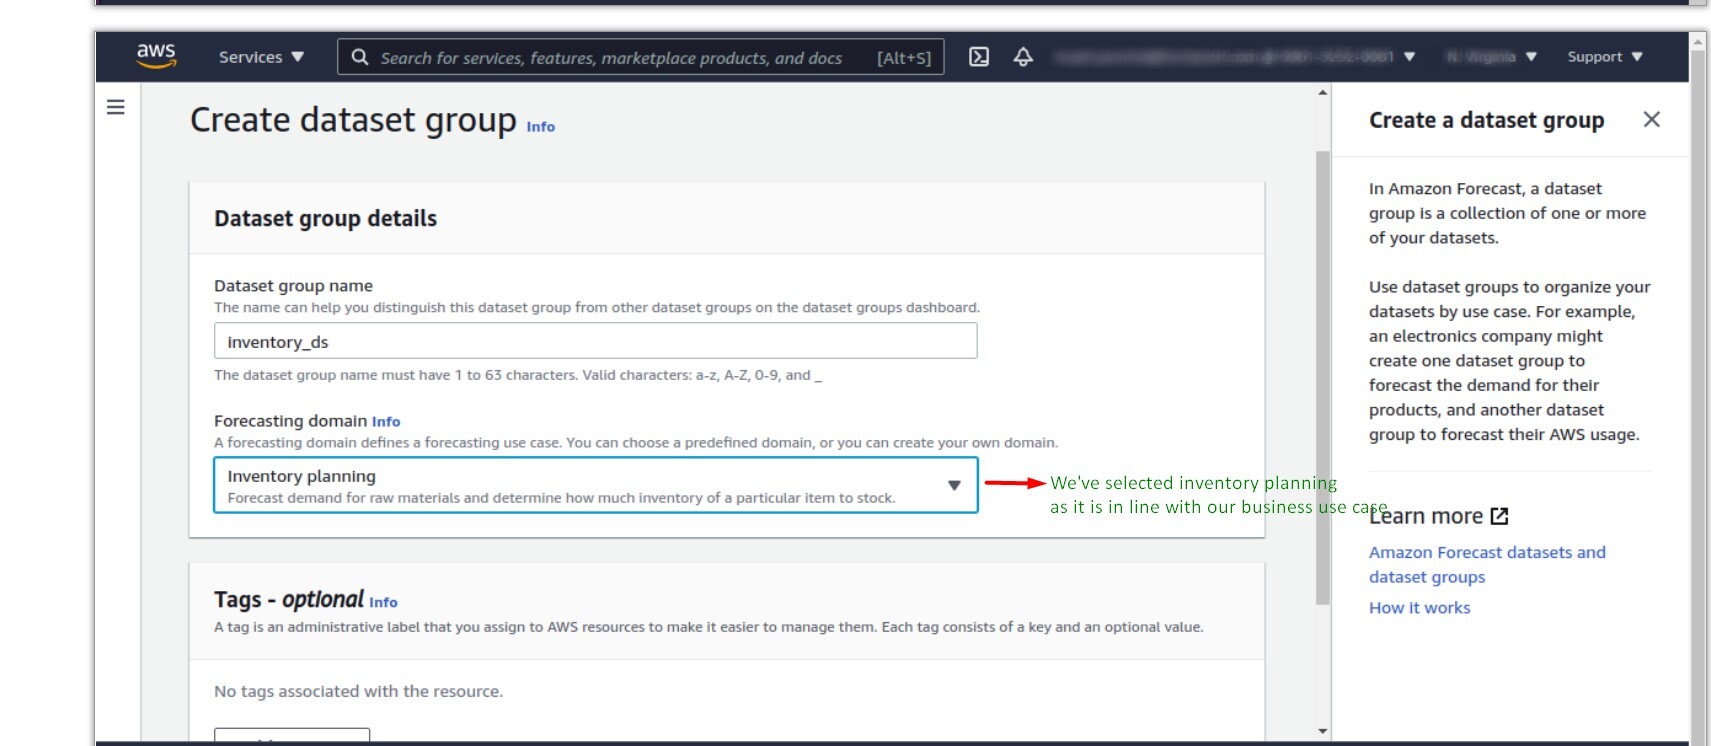
Forecasting domain selection
AWS Forecast supports a range of domains to give you versatile data output. AWS supports the following forecasting domain.

2.Create dataset
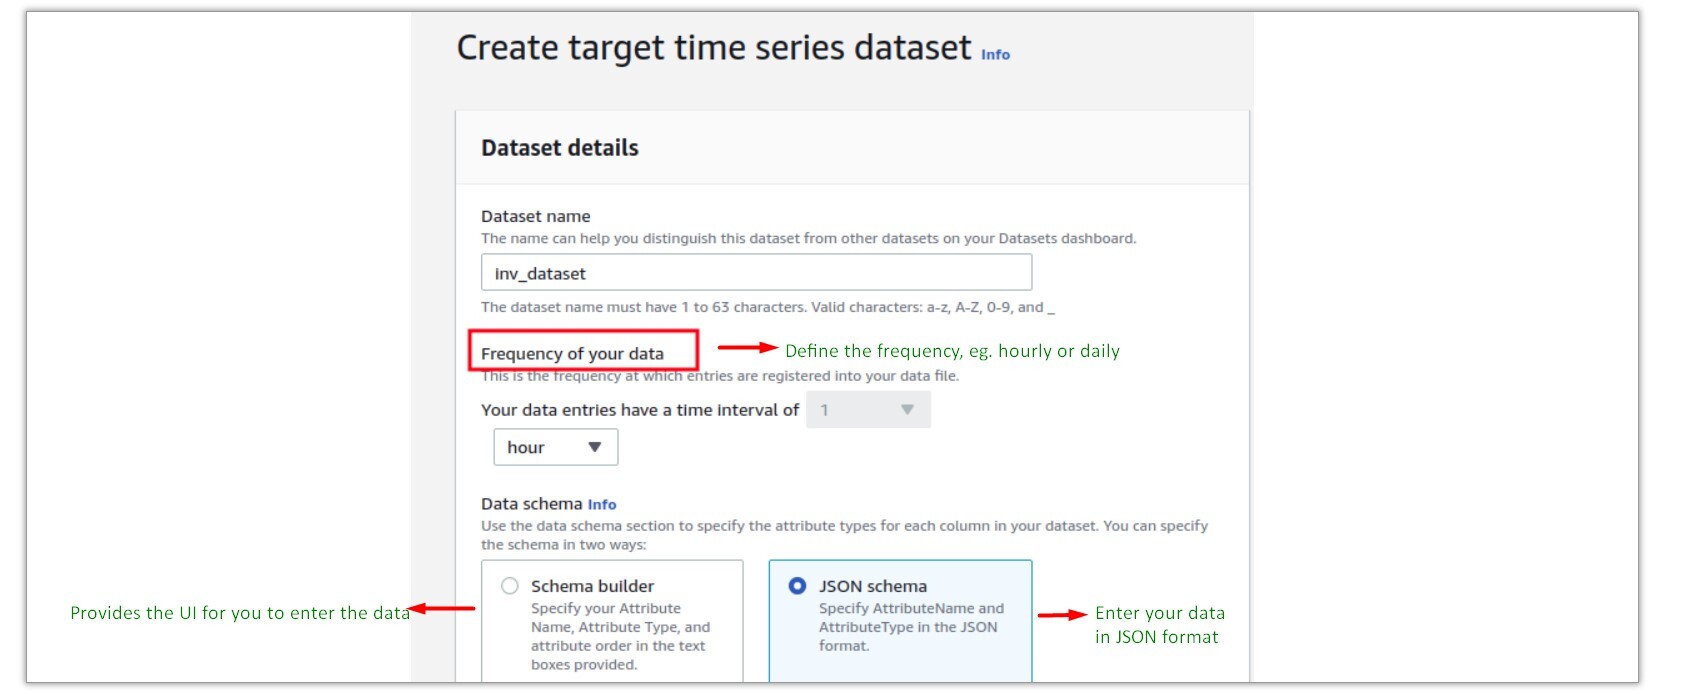
Dataset creation
In case you use the schema builder, the UI is pictured below
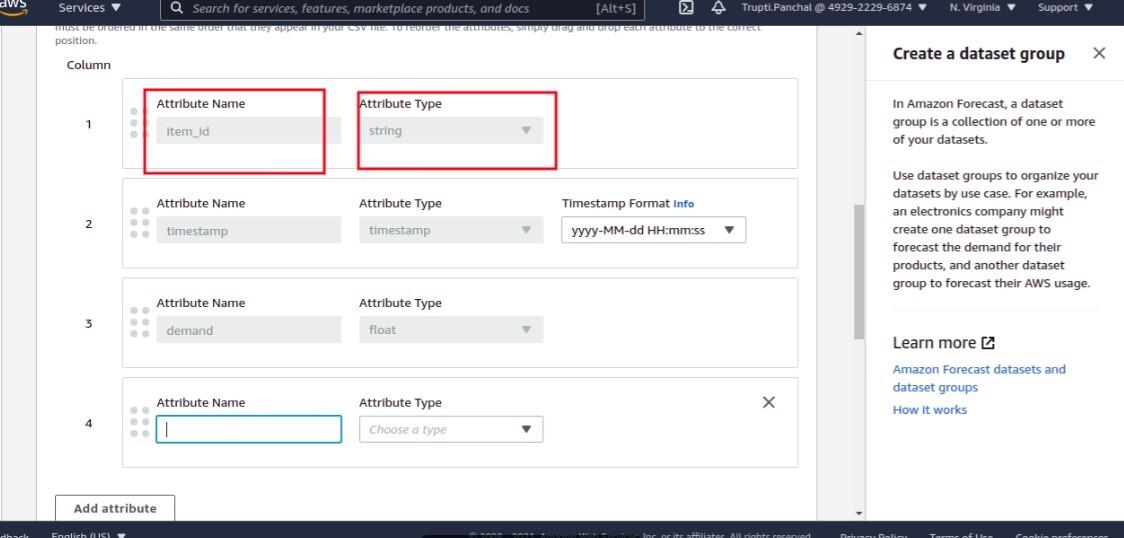

Attribute definition
This must be the same as your csv file, if you have 5 attributes in the file, you need to define 5 attributes in the correct sequence.
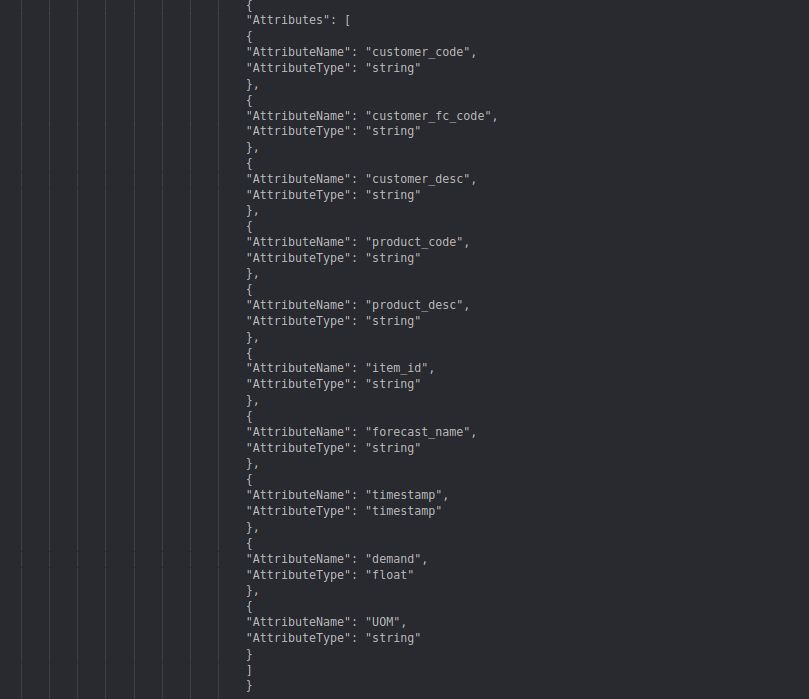
Detailed attribute overview
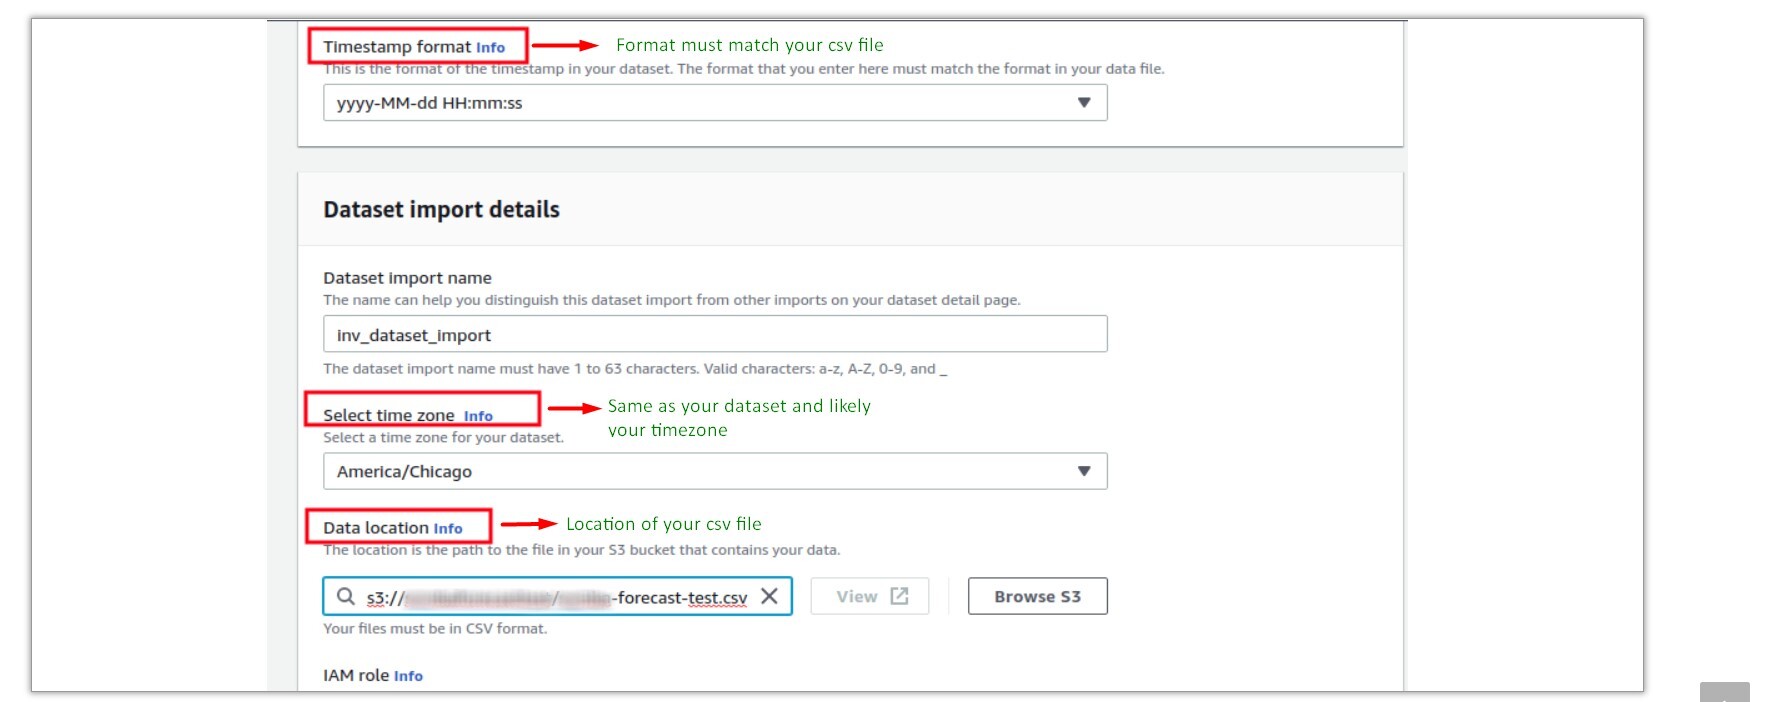
Importing your data file

Defining IAM role
This will take awhile to complete the process.
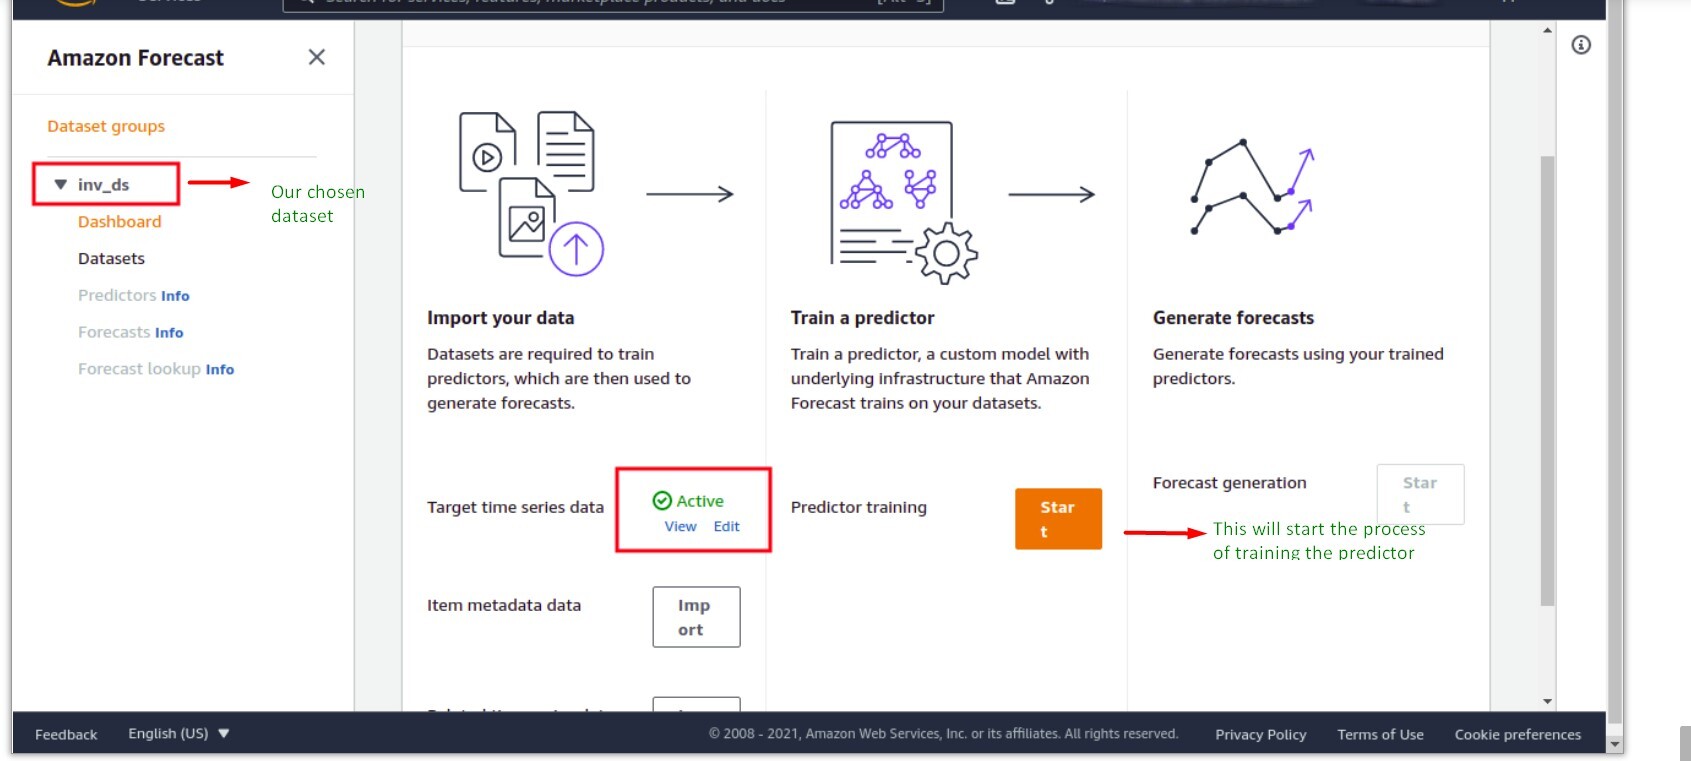
3. Train predictor
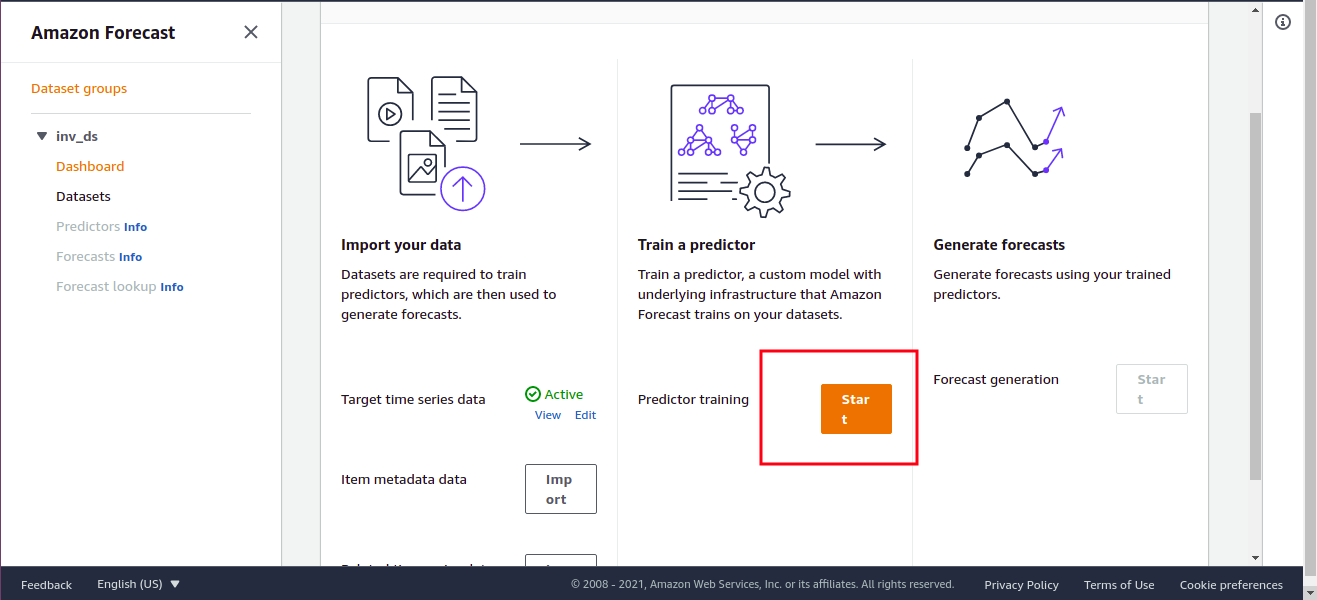

Frequency definition
Amazon Forecast supports the predictors outlined in the next screenshot. We need to test and determine which model will suit our business requirements best.
The ideal way to determine this is:
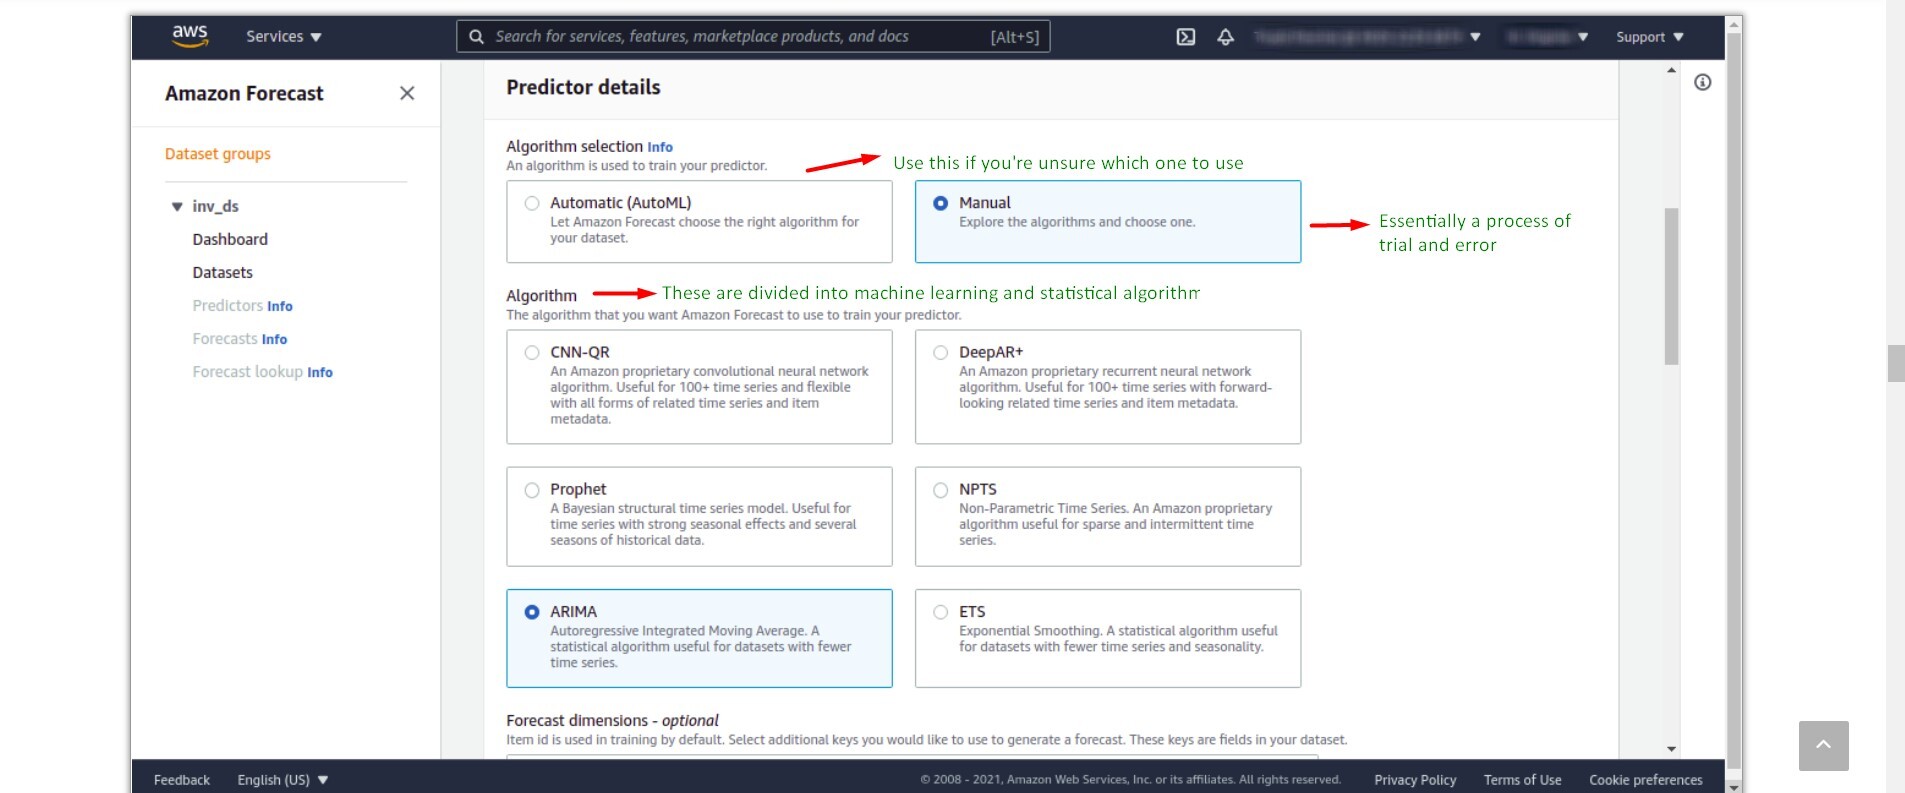
Algorithm selection
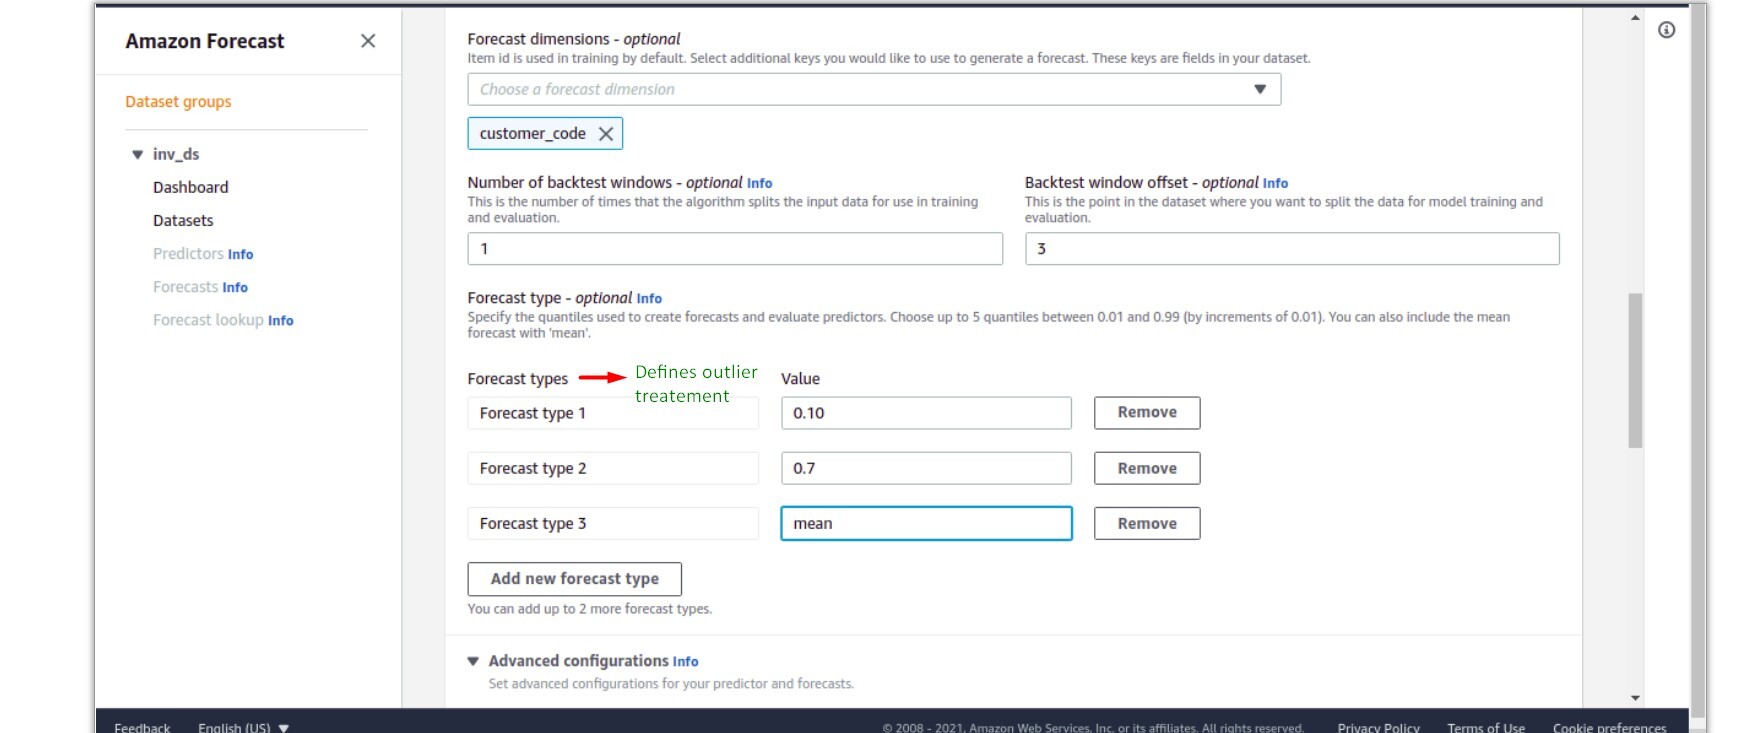
Forecast dimensions
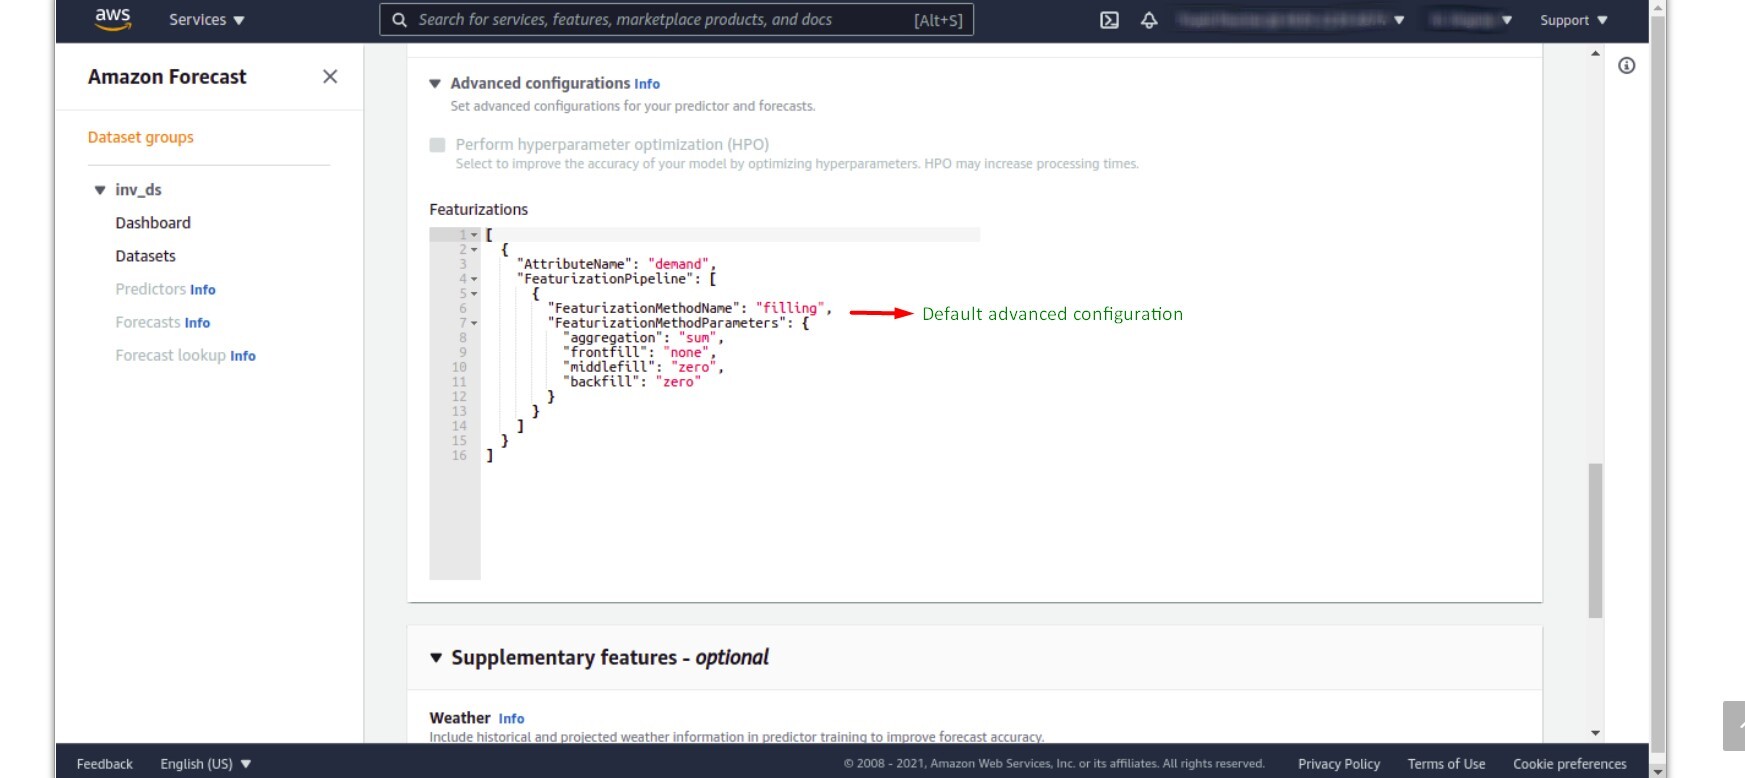
Defining pipeline
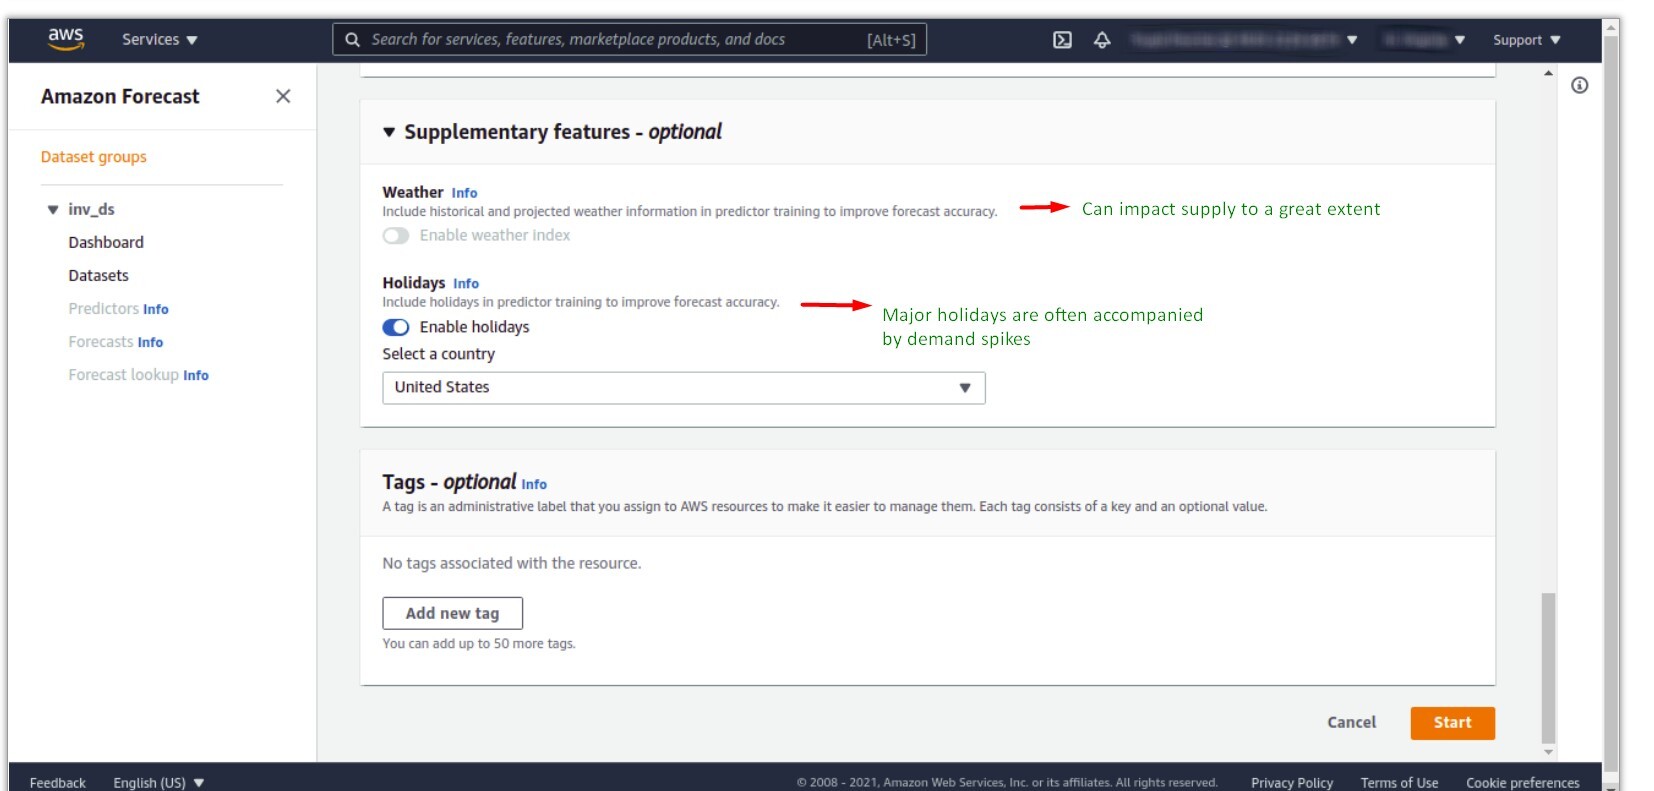
Supplementary features
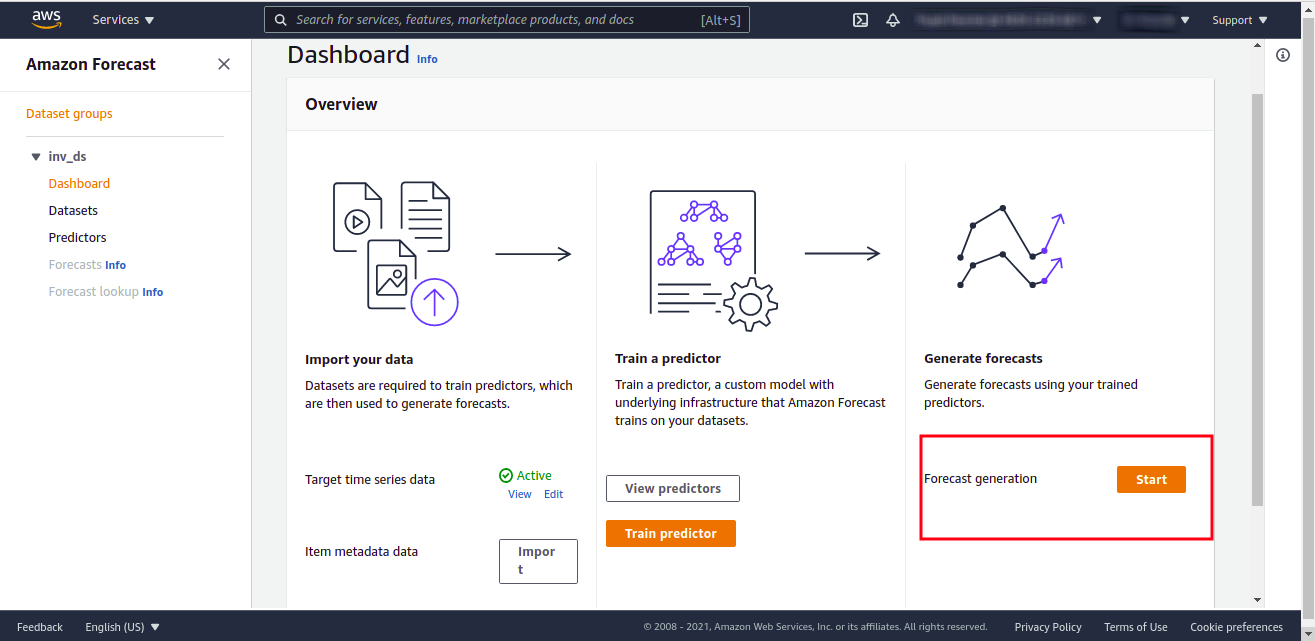
This will start the generation of the forecast, aka the moment we’ve been waiting for.
4. Create Forecast
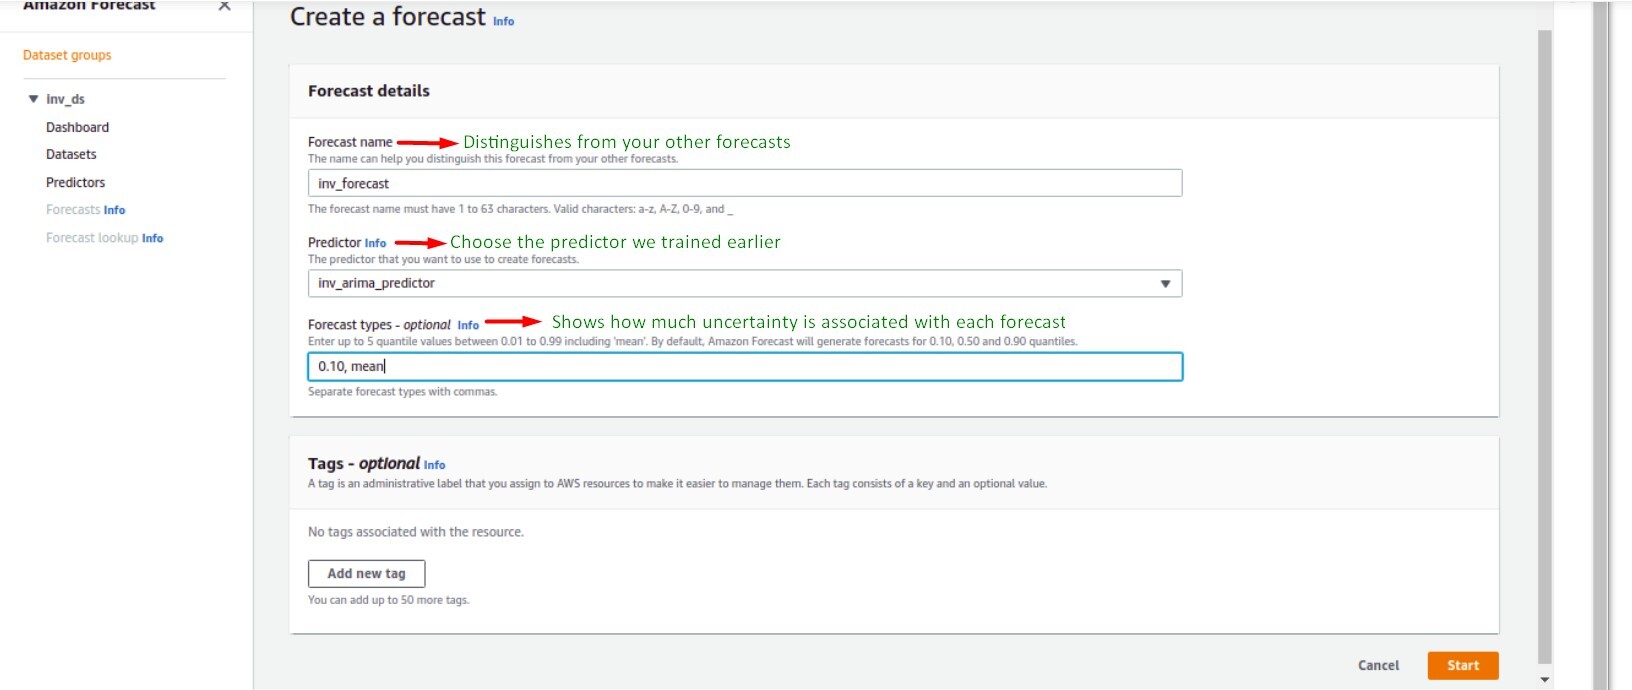
Defining forecast parameters
A note on prediction quantiles: By calculating prediction quantiles, the model shows how much uncertainty is associated with each forecast.
For the P10 prediction, the true value is expected to be lower than the predicted value, 10% of the time. For the P50 prediction, the true value is expected to be lower than the predicted value, 50% of the time, similarly for P90. If you think you might face a problem of storage space or cost of investment if you overstock the item, the P10 forecast is preferable. As you will be overstocked only 10% of the time else you would be sold out every day.
But on the other hand, the cost of not selling the item is extremely high or the cost of invested capital is low or it would result in huge amounts of lost revenue you might want to choose the P90 forecast.
This step will take some time. This is the final step.
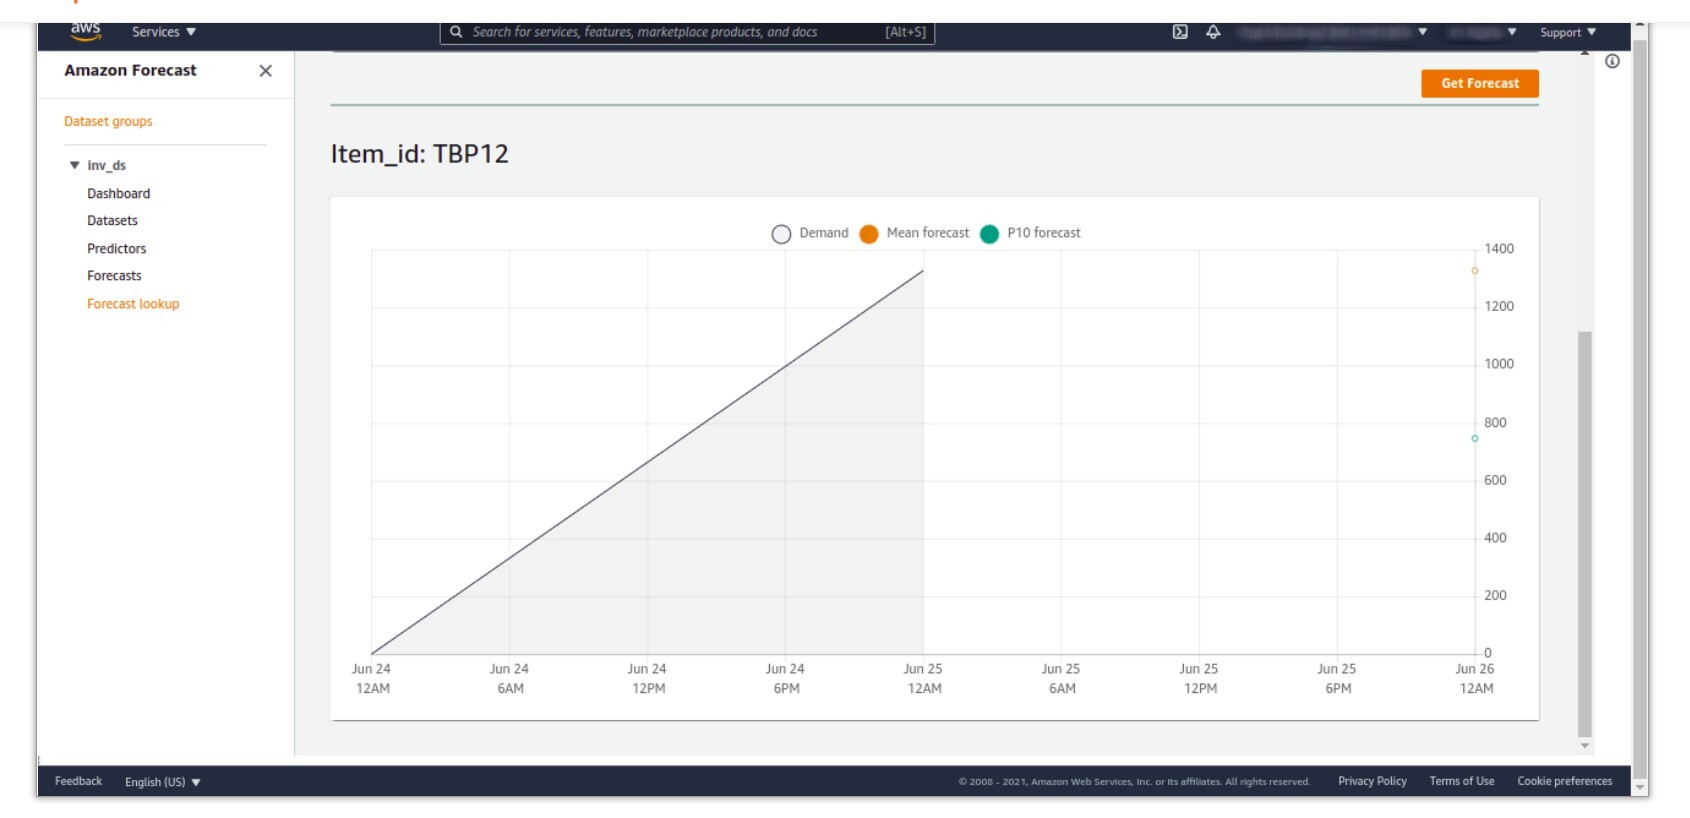
Our output, aka the forecast model
There are 2 ways to get the forecast.
We have used the second option in our case We chose a serverless stack to generate forecasts. As serverless stack will allow us to scale as per the needs of the business and also our cost will be restricted according to our usage.
There are several steps involved in the forecast generation process. The current step information is stored in dynamo db. We have created a generic lambda function called “StatusCheckActionForecast” which knows how to check the status of a current job and also knows how to call the action for the next job based on the step information stored in the dynamo db.

Building AI Agents: The Architecture Guide We Wish We Had Building AI agents turned out to be one of those adventures that started with wide-eyed
Angular Best Practices for Scalable and High-Performance Applications Introduction Staying current with Angular’s latest features is key to writing efficient, scalable, and maintainable applications. This

Breaking the API Mold: A new era of AI-Driven Customer Journeys In the fast- paced world of financial services, speed, accuracy and scalability are critical.
| Cookie | Duration | Description |
|---|---|---|
| cookielawinfo-checkbox-analytics | 11 months | This cookie is set by GDPR Cookie Consent plugin. The cookie is used to store the user consent for the cookies in the category "Analytics". |
| cookielawinfo-checkbox-functional | 11 months | The cookie is set by GDPR cookie consent to record the user consent for the cookies in the category "Functional". |
| cookielawinfo-checkbox-necessary | 11 months | This cookie is set by GDPR Cookie Consent plugin. The cookies is used to store the user consent for the cookies in the category "Necessary". |
| cookielawinfo-checkbox-others | 11 months | This cookie is set by GDPR Cookie Consent plugin. The cookie is used to store the user consent for the cookies in the category "Other. |
| cookielawinfo-checkbox-performance | 11 months | This cookie is set by GDPR Cookie Consent plugin. The cookie is used to store the user consent for the cookies in the category "Performance". |
| viewed_cookie_policy | 11 months | The cookie is set by the GDPR Cookie Consent plugin and is used to store whether or not user has consented to the use of cookies. It does not store any personal data. |